Performance
At the top of the Portfolio page, you’ll see a general overview of your wallet’s performance.
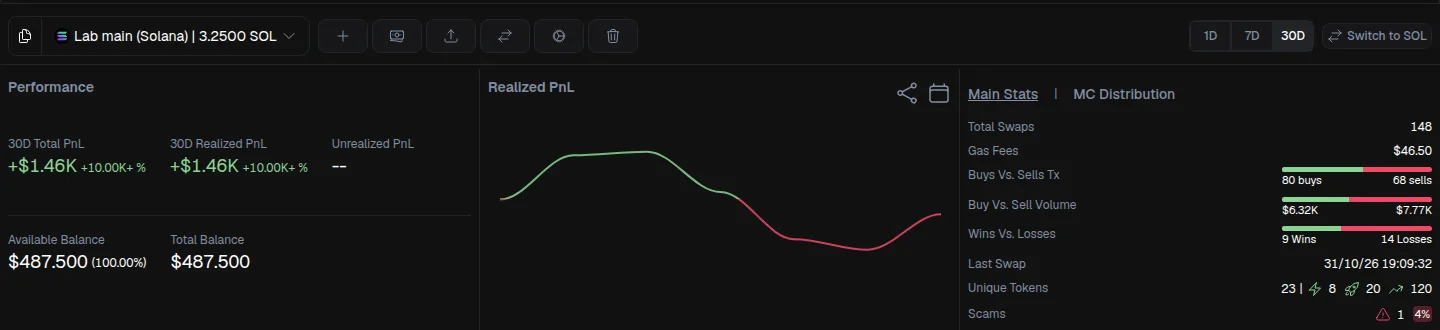
Key Metrics Explained
- Total PnL (Last 30 Days) Shows your total profit or loss over the past 30 days.
- Realized PnL This is the profit (or loss) from closed trades. It means the profit is already secured.
- Profitability (%) Shows how profitable your wallet is overall. This is calculated as: Realized PnL ÷ Total Buy Volume
- Unrealized PnL
This comes form trades that are still open. It shows current profit or loss if you sold now
Success
All profits shown are net profits, meaning:
-
Gas fees are already deducted
-
Wenshot fees (1%) are already deducted
-
Available Balance The amount of SOL or USD that is ready to trade
-
Total Balance Includes: Available balance and all tokens you hold, based on their live market value
Performance Chart (Center Section)
The center chart shows your realized performance over time.
- It tracks how much secured profit you’ve accumulated
-
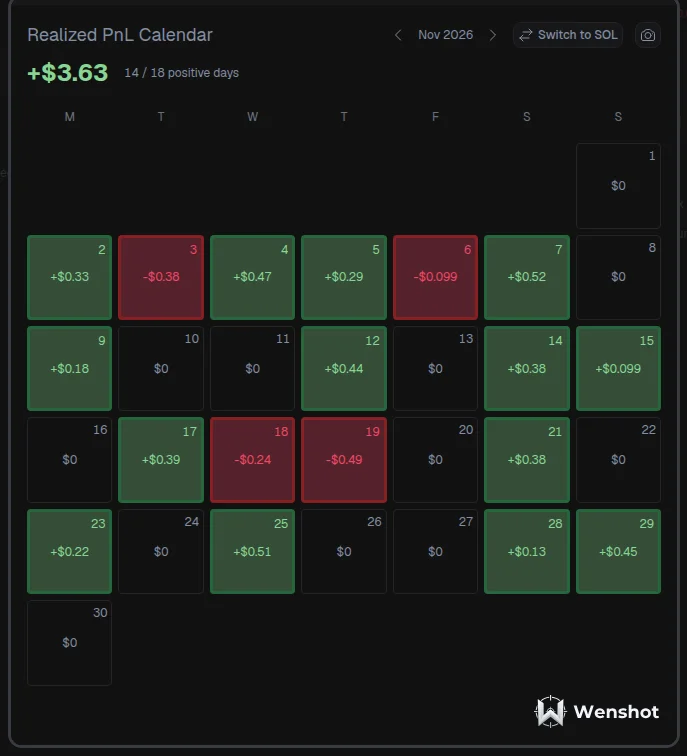
Click the calendar icon to open a daily calendar view to see profit or loss for each day and review your monthly performance. Change months using the calendar controls, or switch from quote to USD view easily.
-
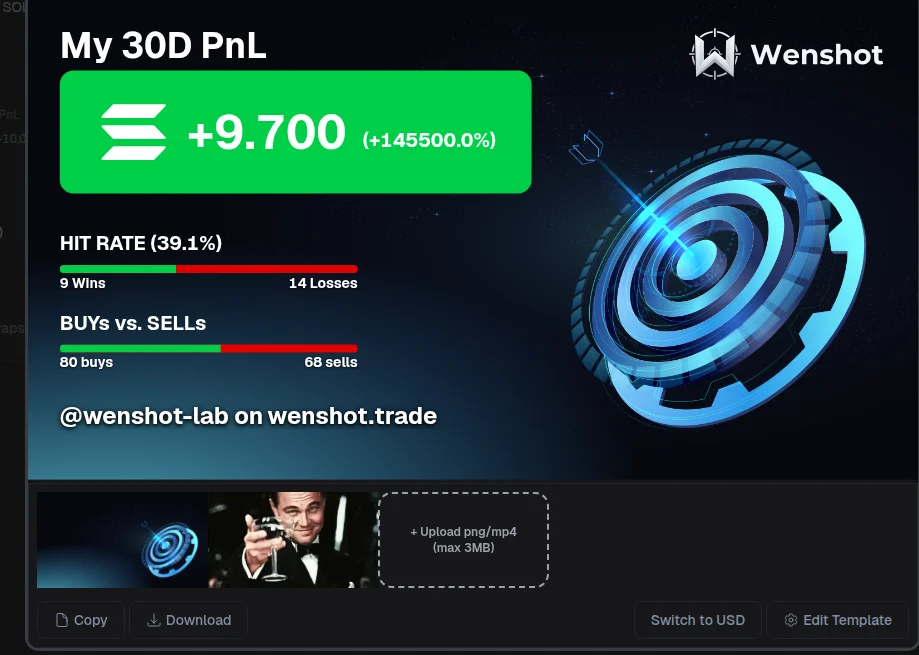
You can share your performance using Wenshot’s advanced sharing tools
Detailed Statistics (Right Panel)
On the right side, you’ll find deeper performance insights:
- Total swaps executed
- Total gas fees paid
Danger
Always check gas fees. If gas fees are too high compared to your profits, consider adjusting your bot settings.
Trading Breakdown
- Buys vs Sells: total number of buy and sell transactions
- Total traded volume
- Wins vs Losses
- Last swap executed
- Token type indicators
- Token Age Breakdown: you can see what types of tokens you traded, based on how old they're
- 🔫 Snipes, tokens launched less than 1 hour ago. These are very new and often high-risk.
- 🐒 Early apes, tokens launched between 1 hour and 1 week ago. These tokens are still early but usually have more data than snipes.
- 🔃 Trades, tokens older than 1 week. These are more established tokens with lower risk compared to very new launches.
- Scams & Rug-pulls: shows how many scam or rug tokens you traded. Keep this number as low as possible
Success
To reduce this:
- Use better trading filters
- Do more research before trading
PnL Distribution by Market Cap
This section shows where your profits and losses came from, grouped by the market cap of the tokens you traded. Use this insight to adjust bot strategies and focus on the most profitable token sizes:
- Micro: market cap below $1M
- Small: market cap above $1M
- Medium: market cap above $10M
- Large: market cap above $100M
- Mega: market cap above $1B
Danger
Reminder: Past performance does not guarantee future results, but it’s very useful for improving your strategy.